
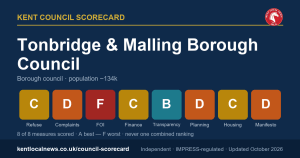
Tonbridge & Malling Borough Council has growing reserves and the third-best recycling rate in Kent, but the lowest freedom of information score, on the Kent Council Scorecard’s October 2026 refresh.
Declaration: Kent Local News is edited by Daniel Dabin, who is also the leader of the GB Freedom party. The Scorecard is scored from published data under a published methodology, every council receives its scores for right of reply before publication, and every score links to its source so that readers can check it.
Tonbridge & Malling Borough Council, which collects the bins, decides planning applications and handles homelessness for about 134,000 people in Tonbridge, Malling and the surrounding area, is scored on eight measures in the October refresh of the Kent Council Scorecard. It scores in band B on one, band C on three, band D on three and band F on one. This is the 13th of 14 pieces, one for each Kent council.
Scores run from 0 to 100 and are banded A to F. They are never added together, because each measures a different service with different data. The full evidence for every score is on the Tonbridge & Malling Borough Council page.
The scores at a glance
| Measure | Score | Band | Position |
|---|---|---|---|
| Refuse collection | 66 | C | 3rd of 13 |
| Complaints handling | 52 | D | joint 9th of 14 |
| Freedom of information | 37 | F | 13th of 13 scored |
| Financial health | 68 | C | 3rd of 14 |
| Transparency | 74 | B | joint 7th of 14 |
| Planning | 52 | D | 11th of 13 |
| Housing and homelessness | 57 | C | 4th of 13 |
| Manifesto delivery (Trust) | 50 | D | joint 9th of 14 |
Education, children’s services, safeguarding, highways and adult social care are run by Kent County Council, so they do not apply to the borough.
Where it does best
On finances, it scores 68, third in Kent. The council underspent its 2024-25 revenue budget by £119,000 and added £1.1m to its reserves. Its usable reserves of £39.9m, about 234% of its net revenue spending, rose by £6.2m in the year, and its auditor found no significant weaknesses. The weak point is capital: it spent £2.9m against an original £6.9m programme, with major projects delayed. Its Band D council tax, £252.65, is the sixth-highest of the 12 Kent districts.
On bins, it scores 66. It recycled 48.4% of household waste in 2024-25, the third-best rate in Kent and well above the England average of 42.0%.
On housing, it scores 57, fourth in Kent. It had 98 households in temporary accommodation at the end of March 2026, 1.74 per 1,000 households, with 131 children among them, below the 2.83 rate for England outside London. 53.4% of its homelessness prevention cases in 2024-25 secured a home for at least six months, against 51.9% for England. Provisional figures for the four quarters of 2025-26 show 69.4% (163 of 235), against 54.0% for England; the score uses the 2024-25 full-year table, the latest published on the same basis for every council, and will be updated when the 2025-26 table is published, scheduled for 26 November. Against that, it met 63% of its requirement under the Housing Delivery Test, so a presumption in favour of development applies to its planning decisions.
On transparency, it scores 74. It publishes monthly spending files, a register of current contracts, councillors’ allowances, senior salaries and live committee papers. It has no log of information released under freedom of information and no open-data portal.
Where it falls short
On freedom of information, it scores 37, the lowest in Kent. The council answered 72.56% of requests within the legal limit of 20 working days in 2025 (706 of 973), against the 90% the Information Commissioner expects. It records its figures by calendar year, where most councils supplied financial years, so 2025 is used. Its figures were 77.42% in 2023 and 74.60% in 2024, and 82.63% in 2026 up to the end of August. The Commissioner issued three decision notices in three years. In one, in June 2025, the Commissioner found that not all the relevant information had been provided until later, a breach of the Environmental Information Regulations, though no further steps were required; the other two were not upheld. The notice sent to the council gave a score of 36; the published 37 applies the same rounding used for every other council, as the methodology change log records.
On complaints, it scores 52. The Local Government and Social Care Ombudsman upheld both complaints it investigated in 2025-26, 1.5 upheld per 100,000 residents against a district average of 1.0, and the council met the agreed timescale on half of the remedies it had to carry out, against a district average of 75%.
On planning, it scores 52. It decided 93.8% of major applications on time over the two years to June 2026, above the England figure of 91.0%, but 86.2% of smaller ones, against 90.7%, and 6.7% of its major decisions were overturned at appeal, against 3.2% for England.
Promises
Kent Local News tracks four pledges from the Conservative and Independent Alliance coalition, on crime, value for money, environmental enforcement and recycling. None has yet been judged, so the Trust score of 50 rests on whether the council’s actions match the issues residents raise.
Who was in charge
The Conservative and Independent Alliance coalition led by Matt Boughton has run the council since May 2023, so almost all the data falls to it. The three-year housing supply figures also reach back to the Conservative majority before May 2023. Each score on the council’s page names the administration in office during the period it measures.
What the council said
Tonbridge & Malling engaged with the right of reply more than any other council. Its head of communications, Diane Talbot, raised questions on 16 October about its transparency, planning and housing scores, and Kent Local News answered on 17 October. Linda Hibbs, its head of housing and regulatory services, said on 21 October she had no further comments.
On freedom of information, Adrian Futers, the council’s information governance manager, said on 8 October that if timeliness was taken from 2025, “it would seem more appropriate to use the same period when considering ICO complaints”, which would mean “two ICO complaints rather than three”. He questioned wording he understood to score the council’s handling of Kent Local News’s own request, and said the June 2025 decision was not “a substantive finding against the Council”. Kent Local News replied that the score uses the council’s own figure of 706 of 973, that its handling of our request plays no part, and that the three-year window for decision notices is the same for all 14 councils.
On transparency, Ms Talbot said the council had brought its transparency links together on a single page and was “exploring the introduction of an FOI disclosure log”. Kent Local News replied that the page brings together items already credited, so the score is unchanged. Both comments are published in full on the council’s Scorecard page.
What it means for Tonbridge and Malling
The borough’s finances and recycling are among the strongest in Kent, while its handling of information requests is the weakest on the council’s own figures. Local news is on the Tonbridge and Malling pages. Tomorrow, the last in the series: Tunbridge Wells. The Scorecard hub has a comparison table for each measure.
The right of reply stays open. Any response from the council will be published word for word beside the score it concerns. Corrections are welcome at editor@kentlocalnews.co.uk.